Learn how to track lead conversion events with Dub Conversions
When it comes to conversion tracking, a lead event happens when a user performs an action that indicates interest in your product or service. This could be anything from:
Signing up for an account
Adding a product to cart
Joining a mailing list
In this guide, we will be focusing on tracking new user sign-ups for a SaaS application as lead events on Dub.
Depending on which authentication framework you’re using, we have a few pre-built guides to help you track lead events when a new user signs up for your SaaS application:
NextAuth.js
Tracking lead events with NextAuth.js
Clerk
Tracking lead events with Clerk
Supabase
Tracking lead events with Supabase
Auth0
Tracking lead events with Auth0
Appwrite
Tracking lead events with Appwrite
If you’re not using any of the frameworks listed above, you can use the following steps to track lead events:
Within the sign-up API request, retrieve the dub_id cookie that was created by the @dub/analytics client-SDK.
Send an event to the Dub API with the dub_id value, as well as your customer’s ID and any other relevant information (email, name, avatar, etc.)
If you don’t have a customer ID, you can also use the email or phone as
the customer ID.
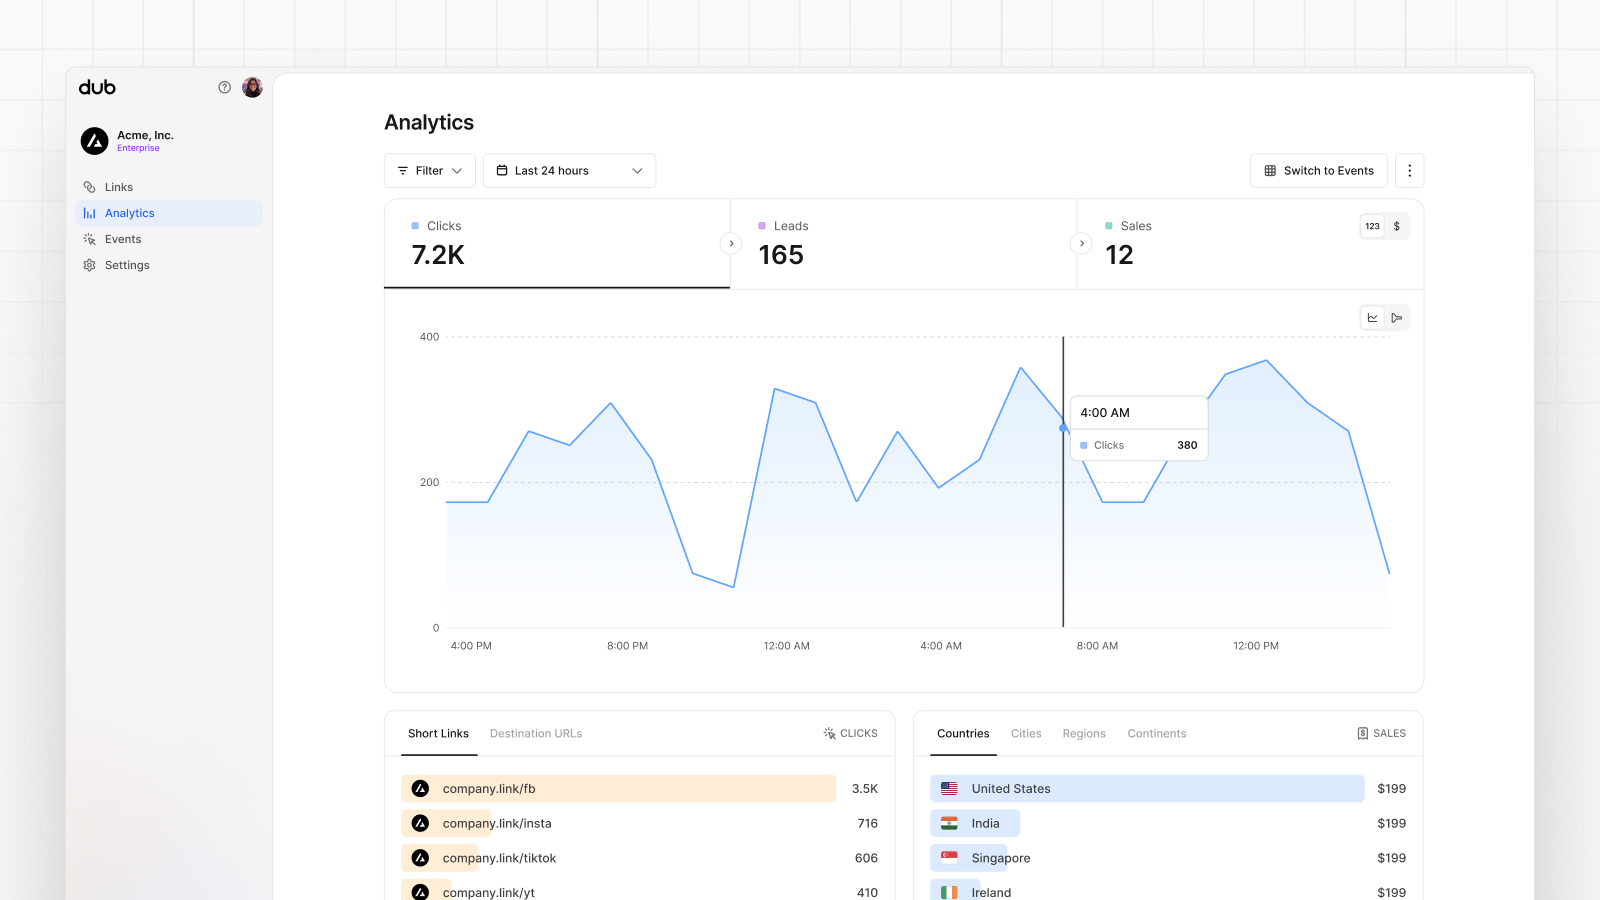
Once you’ve enabled conversion tracking for your links, all your tracked conversions will show up on your Analytics dashboard. We provide 3 different views to help you understand your conversions:
Time-series: A time-series view of the number clicks, leads and sales.
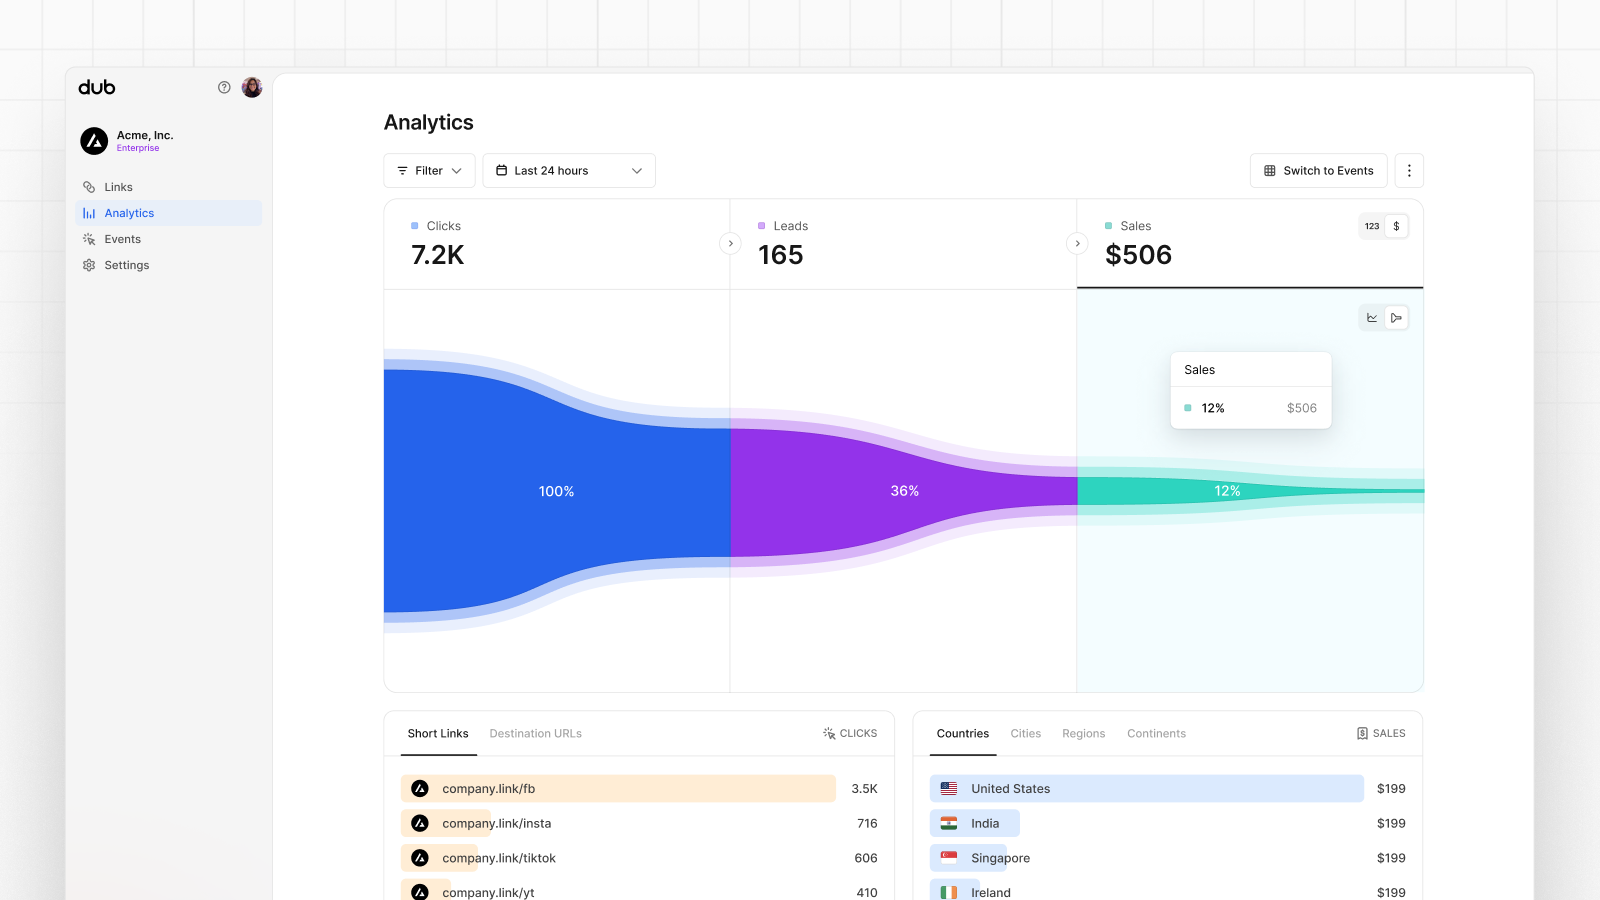
Funnel chart: A funnel chart view visualizing the conversion & dropoff rates across the different steps in the conversion funnel (clicks → leads → sales).
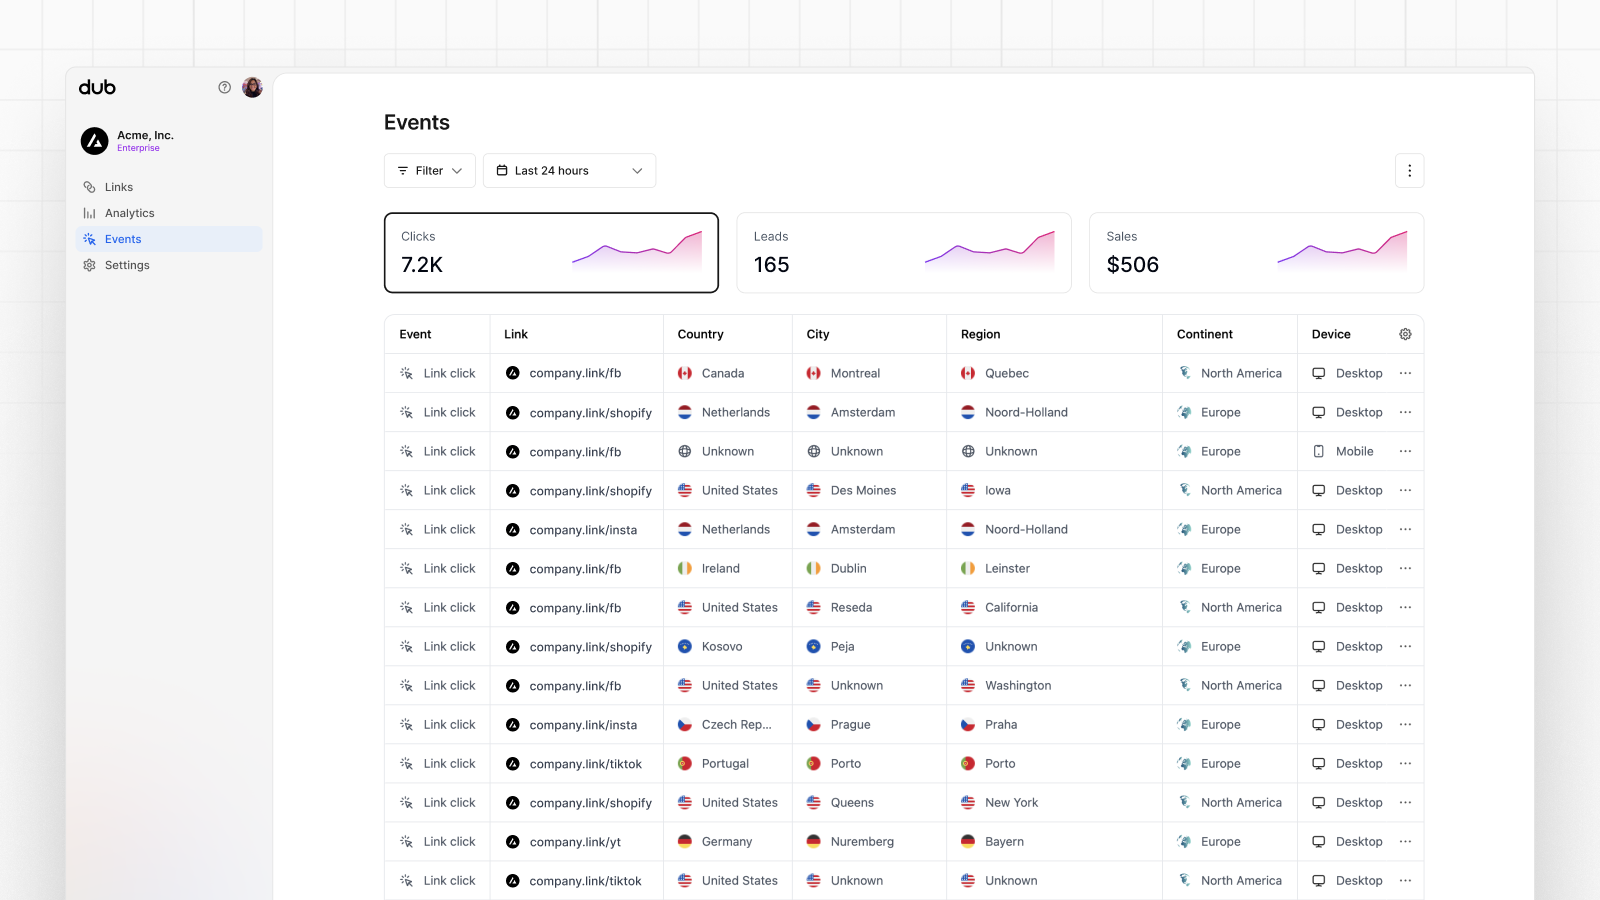
Real-time events stream: A real-time events stream of every single conversion event that occurs across all your links in your workspace.